Example local dev setup with Prometheus and custom metrics
This example uses the local Rig development environment to setup a Prometheus stack emitting custom metrics used to autoscale a capsule.
Using the Rig cli you can spin up a Kind cluster with Rig installed for local development. This can also be spun up with a prometheus stack
rig dev kind create --prometheus
After the command has finished you should be able to see a lot of Prometheus resources created in the prometheus namespace
kubectl get all -n prometheus
should output something like
NAME                                                            READY   STATUS    RESTARTS   AGE
pod/alertmanager-kube-prometheus-stack-alertmanager-0           2/2     Running   0          125m
pod/kube-prometheus-stack-grafana-866dd87656-tw4xr              3/3     Running   0          125m
pod/kube-prometheus-stack-kube-state-metrics-5c68dd7f45-c2hx5   1/1     Running   0          125m
pod/kube-prometheus-stack-operator-7db8f987bb-ntrwt             1/1     Running   0          125m
pod/kube-prometheus-stack-prometheus-node-exporter-6dhs6        1/1     Running   0          125m
pod/prometheus-adapter-59d75fbb56-pdwgt                         1/1     Running   0          125m
pod/prometheus-kube-prometheus-stack-prometheus-0               2/2     Running   0          125m

...
Using the --prometheus flag also sets the prometheusServiceMonitor setting on the Rig operator so it spawns a ServiceMonitor per capsule monitoring ports named metrics. The Prometheus resource created by rig dev kind create is configured to select ServiceMonitors with the rig.dev/capsule label set (which the operator always sets).
kubectl get prometheus kube-prometheus-stack-prometheus -n prometheus -oyaml | yq '.spec.serviceMonitorSelector'
should output
matchExpressions:
  - key: rig.dev/capsule
    operator: Exists
To test the custom metrics we are going to make at setup with two capsule, a producer and a consumer. The produer capsule sends periodically a request to the consumer. For each request, the consumer incrementes a queue counter and asynchronously decrements the queue counter once every 0.5-1.5s. This is to simulate a set of consumers each with their own queue of tasks they will process. The consumers emit their queue size as a metric we will horizontally scale them with. If the queues get too big it's indicative that there are too few consumers.
Create two capsules like so
rig capsule create consumer
rig capsule create producer
Then deploy the following consumer/producer image to them (the code, for the interested)
rig deploy consumer --image almostuseful/consumer
rig deploy producer --image almostuseful/producer
At this point we should be able to see two ServiceMonitors (one for each capsule) created in the kubernetes namespace of the Rig project (called demo in this case).
kubectl get servicemonitor -n demo
outputs
NAME       AGE
consumer   12m
producer   12m
The consumer capsule has not exposed a port yet which we need to do. Store
interfaces:
    - port: 2112
      name: metrics
in a file, e.g. network.yaml and deploy it to the capsule
rig deploy consumer --set-network-interface network.yaml
We use port 2112 both for Prometheus metric emission and the endpoint which the producer calls on the consumer. The name of the port, metrics, is not arbitrary as the ServiceMonitors are setup to monitor endpoints called metrics. Run
kubectl get servicemonitor consumer -n demo -oyaml | yq '.spec'
to verify.
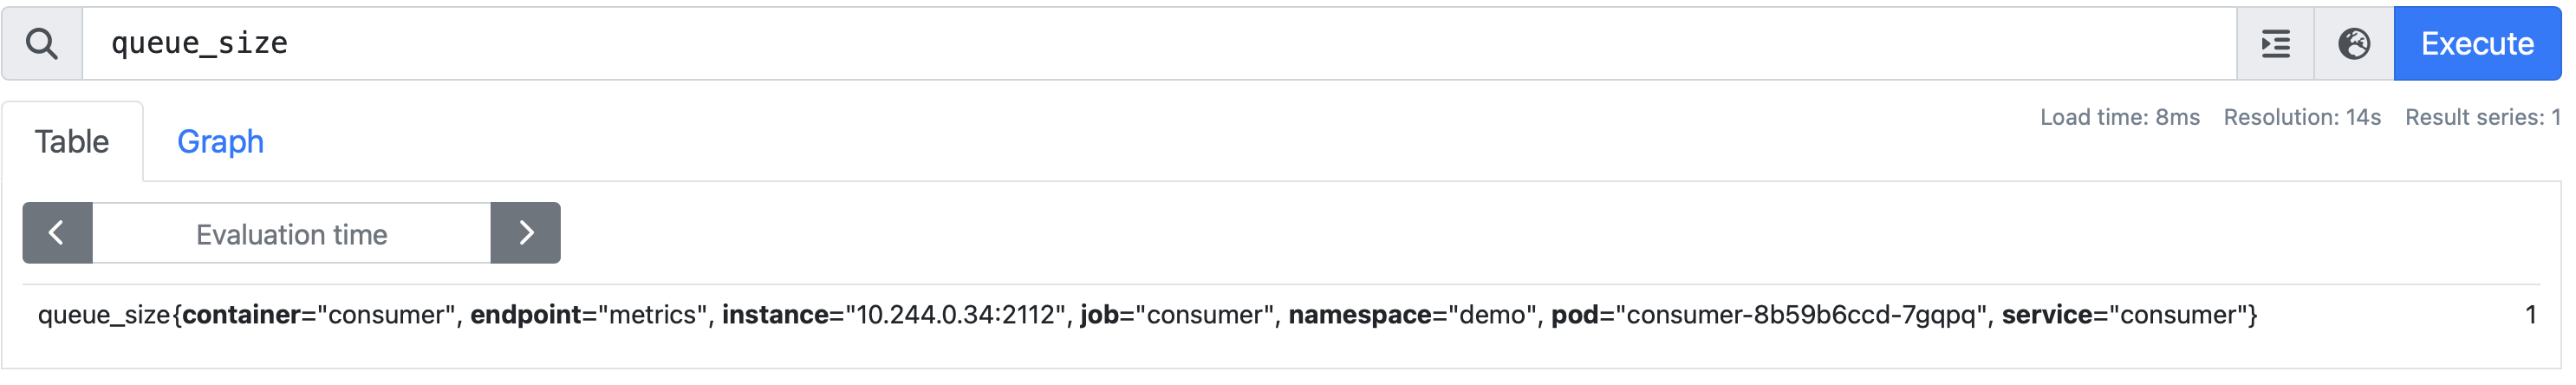
With this we should be able to see Prometheus pick up a metric queue_size from the consumer. You can port-forward the port which Prometheus exposes
kubectl port-forward pod/prometheus-kube-prometheus-stack-prometheus-0 -n prometheus 9090:9090
and then go to localhost:9090 and query for queue_size.
Although the metric is now picked up by Prometheus, it has yet to be picked up by the Prometheus Adapter so it can be consumed through the custom.metrics.k8s.io API. We need to configure some rules for the prometheus adapter to pick up our queue_size metric.
Save the following minimal config in a file, e.g. adapter-config.yaml and apply it
apiVersion: v1
kind: ConfigMap
metadata:
  name: prometheus-adapter
data:
  config.yaml: |
    rules:
    - seriesQuery: 'queue_size'
      metricsQuery: <<.Series>>
kubectl apply -f adapter-config.yaml -n prometheus
It can take some minutes for the adapter to scrape the metrics, but it should find the queue_size metric. We are now ready to setup the autoscaler to listen on the custom metrics. The following configuration enables the autoscaler and it will try to maintain that the average queue_length doesn't exceed 5
maxReplicas: 5
minReplicas: 1
customMetrics:
- instance:
    averageValue: "5"
    metricName: queue_size
rig capsule scale horizontal autoscale consumer --path autoscalerconfig.yaml
After this deployment we should be able to see the autoscaler operating and fetching values from the custom metric
kubectl get horizontalpodautoscaler -n demo
NAME       REFERENCE             TARGETS   MINPODS   MAXPODS   REPLICAS   AGE
consumer   Deployment/consumer   4/5       1         5         1          96s
Finally, to see the autoscaling kick in we need to up the frequency with which the producer sends requests to the consumers. The default is 1 second, but we can increase it by setting an environment variable REQUEST_TIME on the producer
rig deploy producer --set-env-var REQUEST_TIME=250ms
An easy way to quickly inspect the queue size of each consumer is to look at the logs of the capsule. For each element a consumer 'pops' from its queue, it prints the queue size
rig capsule logs consumer ---follow
consumer-8b76d9989-h8w84 2023-12-06T14:32:23.160167215Z: Queue size 29
consumer-8b76d9989-h8w84 2023-12-06T14:32:24.611777882Z: Queue size 28
consumer-8b76d9989-h8w84 2023-12-06T14:32:25.288842716Z: Queue size 27
consumer-8b76d9989-h8w84 2023-12-06T14:32:26.687771008Z: Queue size 28
consumer-8b76d9989-h8w84 2023-12-06T14:32:27.630559634Z: Queue size 27
consumer-8b76d9989-nzxcf 2023-12-06T14:32:28.288782051Z: Queue size 0
consumer-8b76d9989-gz7mm 2023-12-06T14:32:28.508244509Z: Queue size 1
consumer-8b76d9989-h8w84 2023-12-06T14:32:29.105351051Z: Queue size 28
consumer-8b76d9989-h8w84 2023-12-06T14:32:29.614929968Z: Queue size 28
consumer-8b76d9989-zlfq6 2023-12-06T14:32:29.825761468Z: Queue size 2
consumer-8b76d9989-gz7mm 2023-12-06T14:32:29.994360552Z: Queue size 1
consumer-8b76d9989-zlfq6 2023-12-06T14:32:30.356317593Z: Queue size 1
consumer-8b76d9989-h8w84 2023-12-06T14:32:30.592397135Z: Queue size 27
At the start we have only one consumer with a large queue. This prompts the autoscaler to spin up more instances which then can take on requests, easing the load on the first instance.
This walkthrough shows how you can setup Prometheus and the Adapter to work well with Rig to enable autoscaling on custom metrics. Of course, if you have a different metric setup, Rig can still spin up an autoscaler which monitors for custom metrics.